Individual Transaction
Real-Time Active Service Monitoring
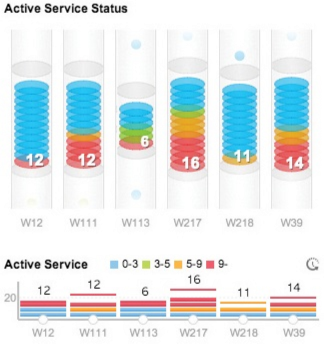
Real-Time Active service monitoring provides speed meter graphs for all processes by which user requests are handled, from immediately after the request hits the Web application server.


It is possible to monitor information on transaction execution status, including which transactions are not yet processed, which users are suffering response delay, and which SQL query is currently executing.
JENNIFER X-View
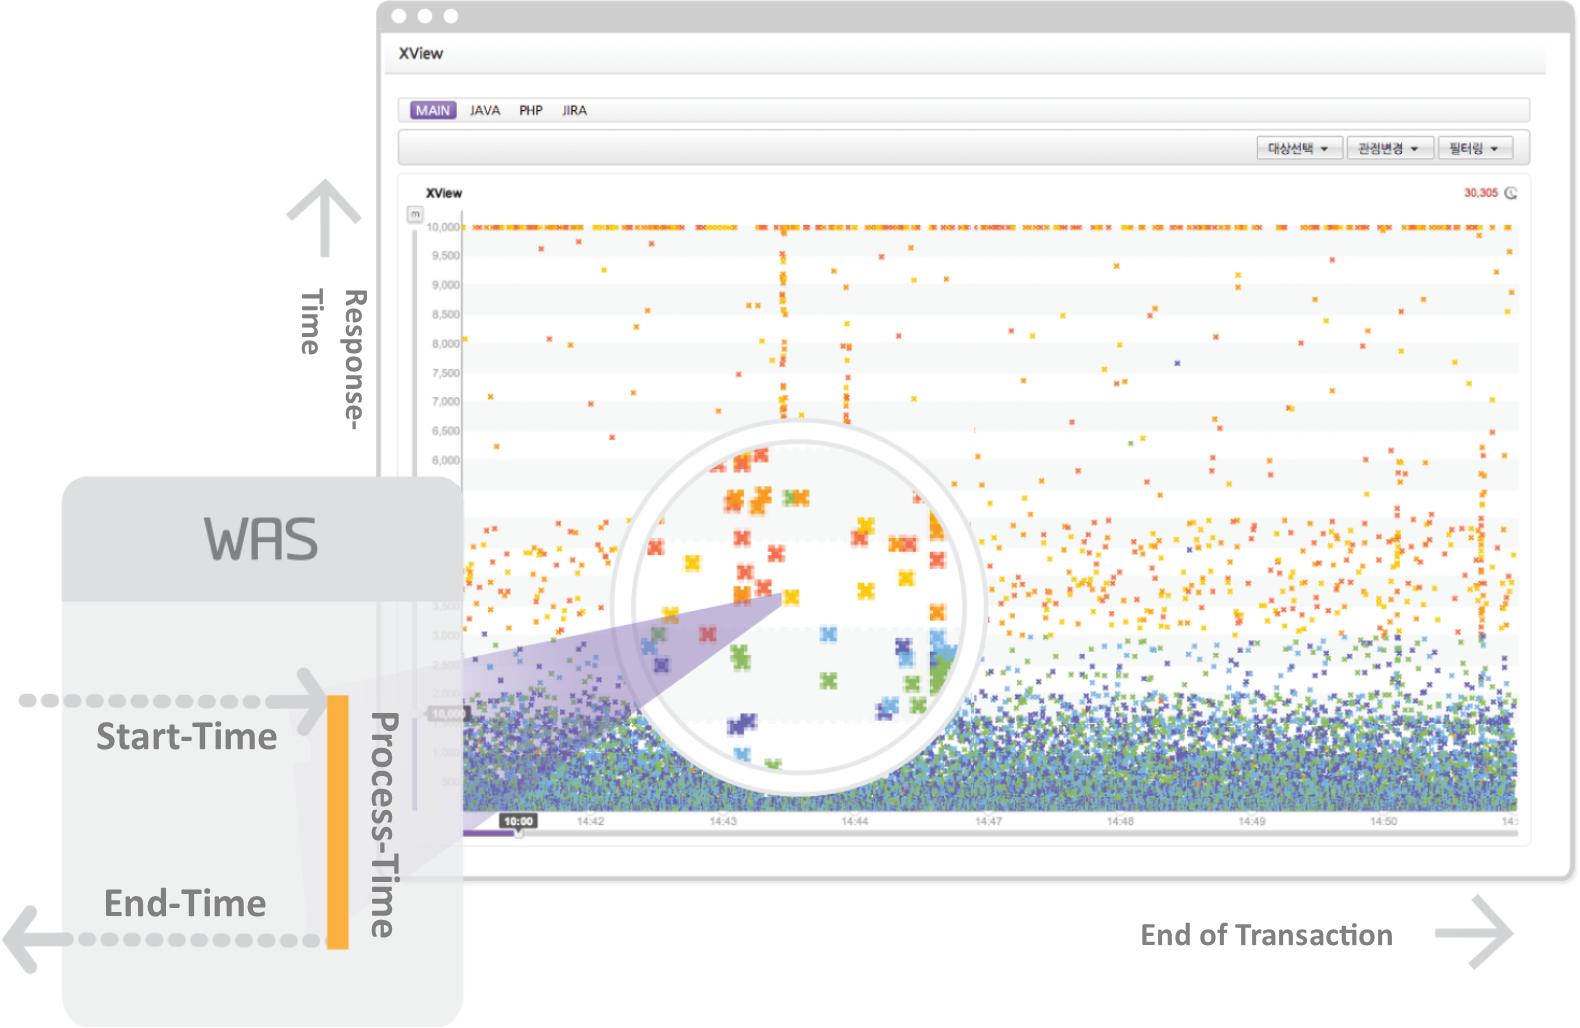
X-View is a chart, developed by JenniferSoft, which visualizes response times for all executed transactions in graph form. Users can monitor the response times of all services at a glance through X-View in order to discover bottleneck patterns. It also enables analysis of transactions, users, applications, etc. from various perspectives.

Smart Profiling
JENNIFER’s X-View analysis tool, showing the response times of individual transactions, has proven its worth to many customers. Profiling and analysis of individual transactions are advanced functions tools used by developers or professionals specializing in performance tuning. So, JENNIFER also provides a Smart Profiling function that enables easy analysis and configuration of profiling data. This function is so simple to use that anyone can quickly and accurately identify the location of a performance deterioration or a processing delay in a transaction by using filtering and analysis.

This post is also available in German.
 German
