German
Role-Based Dashboard View
As new IT trends such as mobile devices, the cloud and big data have emerged, management of IT operations has become more complex. In Web environments it is becoming difficult to monitor the sheer number of transactions across multiple applications in a rigorous way. JENNIFER has revolutionized APM in terms of monitoring capabilities, the ability to inspect individual transactions, the provision of architectural and platform overviews, and in terms of its user views.
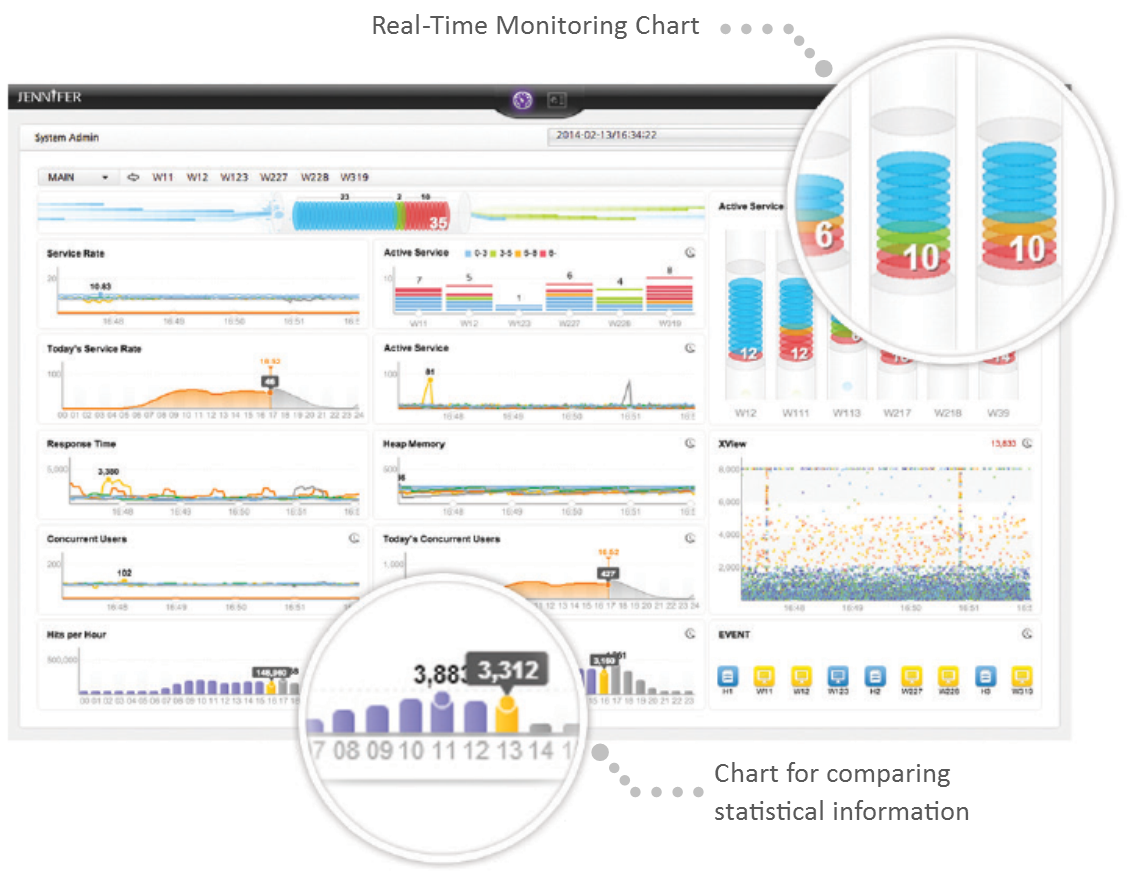
System Administrator Dashboard
When performance issues occur, the system administrator is responsible for identifying problems and stabilizing the operation of services. The system administrator dashboard consists of a real-time monitoring chart for services and system resources and a chart for comparing statistical information. With these charts, the system administrator can not only analyze the service load and performance status but also carry out normal system operations.
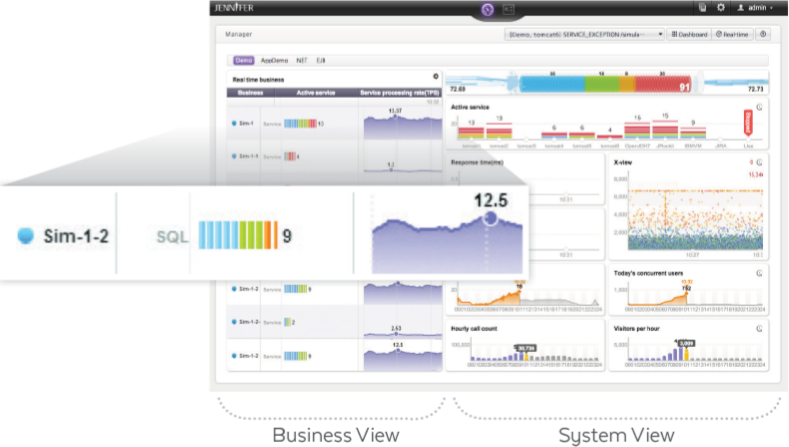
Manager Dashboard
Although this dashboard relates primarily to mangers in the IT department, it is possible that a consulting team or IT planning group would require the ability to monitor operations in a similar way. The manager dashboard provides monitoring functions organized into two different perspectives. With these function, the manager can intuitively identify correlations that indicate the causes of a deterioration in business performance. It is possible to see whether the deterioration is a problem with the system as a whole or only a particular part of the business. The manager can also facilitate communication between personnel who are responsible for relevant activities in the IT department or elsewhere. It is the manager’s role to ensure that everyone works together to provide seamless IT services to the business. To achieve this, it is necessary to monitor both the system and the business.
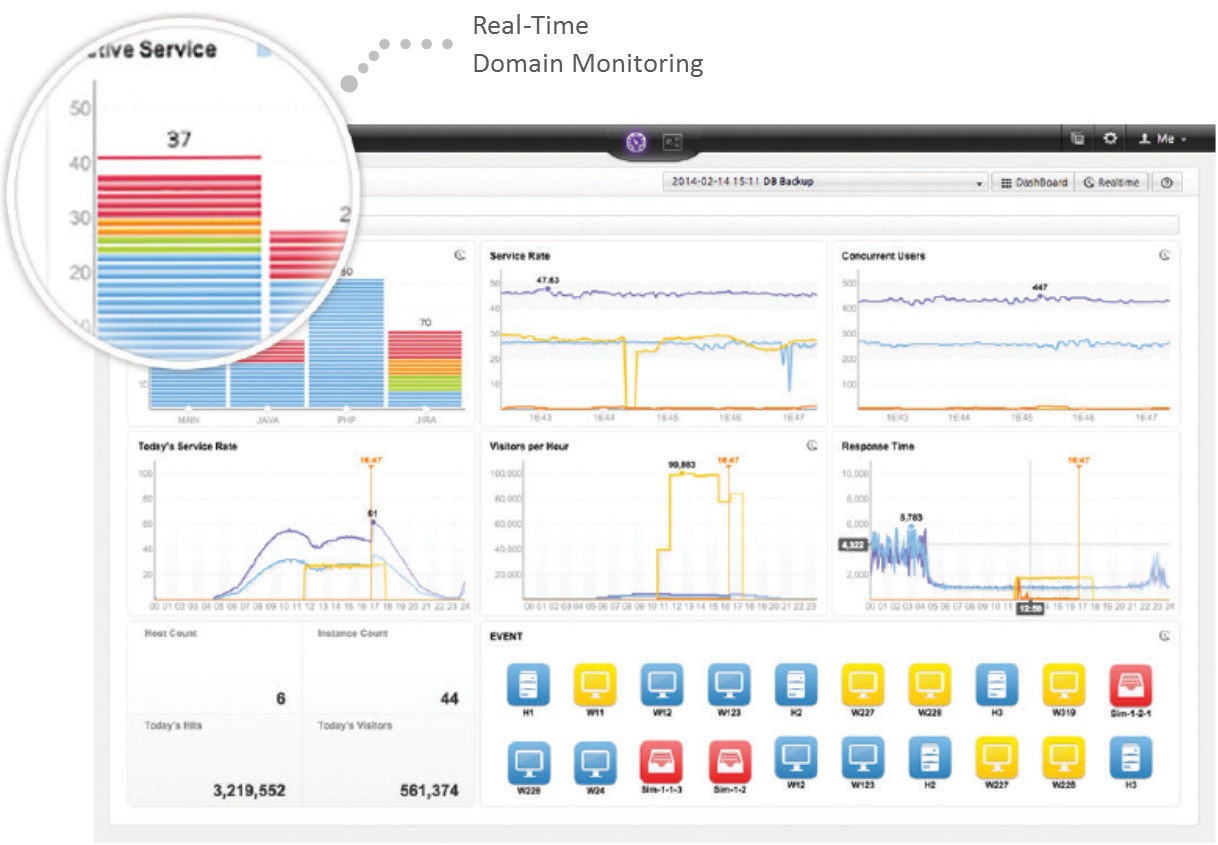
Multi-Domain Dashboard
This dashboard enables management of a large-scale system in a cloud environment with minimal human input. These days, it is essential that APM solutions are able to cope with such systems. JENNIFER’s multi-domain dashboard is comprised of a real-time active service chart, an overall performance chart showing the status of the entire system and a chart showing event notifications. With these tools it is possible to monitor multiple domains in a large-scale enterprise environment, in real time, and all from a single screen.
This post is also available in German.